
Binance Coin was trading upwards in October-November and was at its high of $696. The coin had been profitable for the bulls, with a return of 106% in that period. From the beginning of December, the BNB coin price had constantly declined and fell to $337. The coin was moving below the downtrend line in the past two months, and recently the coin began to ascend from its support zone, but the price couldn’t close above the swing high of $445. BNB coin is currently trailing on the edges of the trend-line, and if it continues to descend, it may reach its support line.
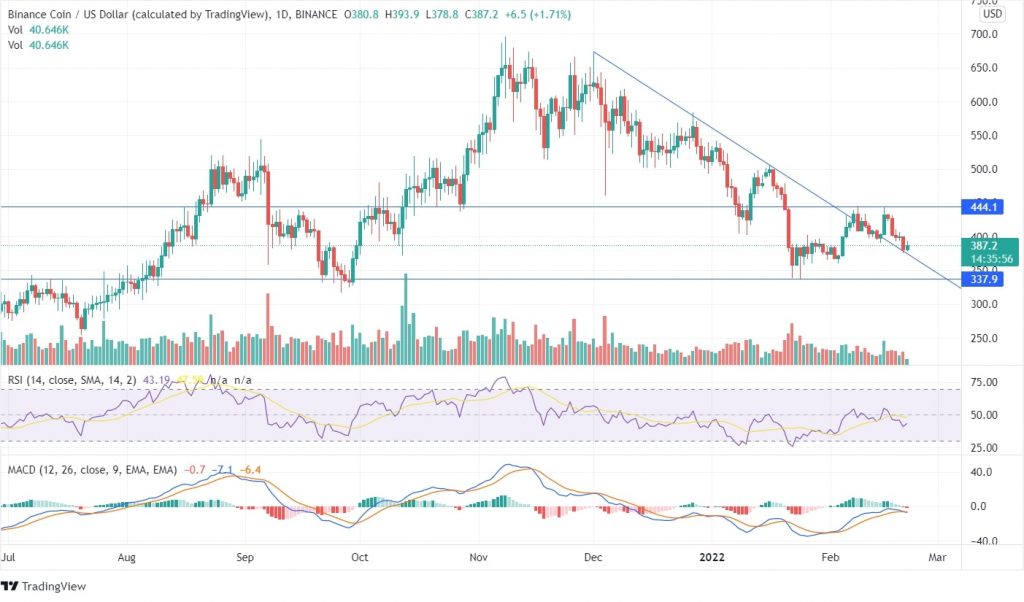
On the daily chart, the MACD line and the signal line are intersecting each other, and the upcoming price action depends on the price of Binance Coin closing above $445 or below $359. The RSI indicator is at 42, is currently neutral, and the price may lead in any direction. On February 15, the volume bar favored bulls, and the bullish candle suppressed the downtrend line, but still, the price couldn’t uplift, and the bearish candle was formed. This can be an opportunity for the bears as the price got rejected at a vital point from where it could ascend. Traders should explore experts’ price projections to know more about the BNB coin’s potential for the upcoming years.
On the weekly chart, the technical parameters are in the bearish zone, and the coin is low. For the past 4 weeks, the price has been moving in the sideways channel within the price range of $444 and $337. The investors should wait for the forming candles to close above or below the swing high or swing low before investing.