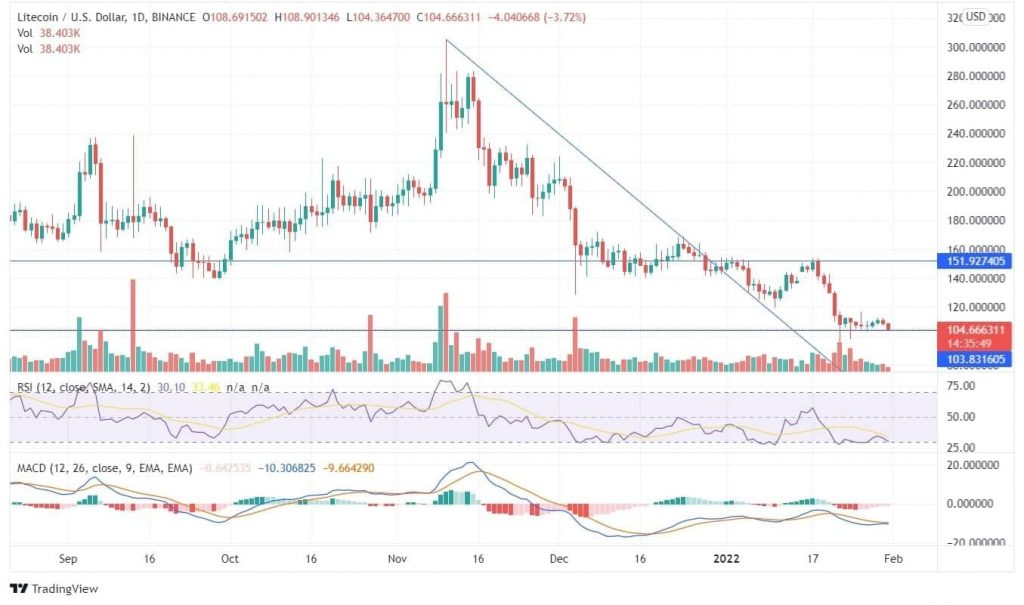
Litecoin has dropped from its peak of $305 since November and is trailing at its bottom horizontal line with the current price of $104. In the past three months, the coin has marked a correction of 190%. However, the coin got tested twice at the support line but failed to close below it. The coin was strongly following its downtrend line till the beginning of this year. Currently, LTC trades under a range-bound area.
LTC is moving in the same range as it was last June end, from where the coin began to rise and reach its peak of $305. The coin has got tested several times at the downtrend line as well as at the top horizontal line but has failed to ascend after the formation of swing highs. Litecoin value is revolving at the price level from where it may deteriorate towards its lows, or it may rise towards its highs. The upcoming price action depends on the price closing above or below the bottom horizontal line.

On the above chart, the MACD line is below the signal line, but both of them are adjacent to each other. A trivial movement of the price in an upward direction may show a buy signal. The RSI being 30 has entered the oversold zone. Yesterday, the LTC coin plunged almost 4.67%. Since the last month, the price of Litecoin has been trading around $150, but later, it registered a sharp fall around mid-January.
On the weekly chart, MACD is already in the bearish zone for the past two months, and the coin has declined 65% from that time period. LTC is currently moving at the edges of the support line. There was a formation of a bearish engulfing pattern on January 17 in the weekly chart, which may indicate the further downfall of the coin. Visit here to have a clear idea of the coin’s future. In the current scenario, the investors and traders should wait for a clear chart view in the upcoming sessions.


